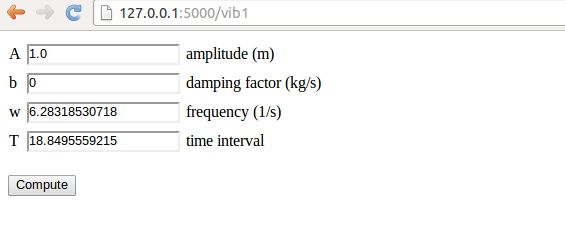
Figure 7: The input page.
The scientific hello world example shows how to work with one input
variable and one output variable. We can easily derive an extensible
recipe for apps with a collection of input variables and some
associated HTML code as result. Multiple input variables are listed
in the InputForm class using different types for different forms
(text field, float field, integer field, check box field for boolean
values, etc.). The value of these variables will be available in a
form object for computation. It is then a matter of setting
up a template code where the various variables if the form object
are formatted in HTML code as desired.
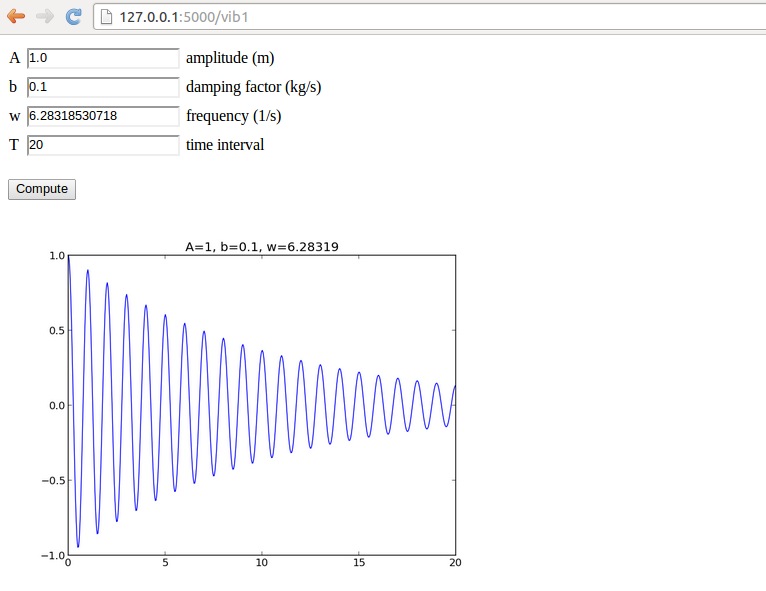
Our sample web application addresses the task of plotting the function \( u(t)=Ae^{-bt}\sin (wt) \) for \( t\in [0,T] \). The web application must have fields for the numbers \( A \), \( b \), \( w \), and \( T \), and a Compute button, as shown in Figure 7. Filling in values, say \( 0.1 \) for \( b \) and \( 20 \) for \( T \), results in what we see in Figure 8, i.e., a plot of \( u(t) \) is added after the input fields and the Compute button.
Figure 7: The input page.
Figure 8: The result page.
We shall make a series of different versions of this app:
vib1 for the basic set-up and illustration of tailoring the HTML code.vib2 for custom validation of input, governed by the programmer,
and inlined graphics in the HTML code.vib3 for interactive Bokeh plots.gen for automatic generation of the Flask app (!).login for storing computed results in user accounts.upload for uploading files to a web app.
The forthcoming text explains the necessary steps to realize a
Flask app that behaves as depicted in Figures 7
and 8. We start with the
compute.py module since it contains only the computation of \( u(t) \)
and the making of the plot, without any interaction with Flask.
The files associated with this app are found in the vib1 directory.
More specifically, inside compute.py, we have a function for
evaluating \( u(t) \) and a compute function for making the plot. The
return value of the latter is the name of the plot file, which should
get a unique name every time the compute function is called such
that the browser cannot reuse an already cached image when displaying
the plot. Flask
applications must have all extra files (CSS, images, etc.) in a
subdirectory static.
from numpy import exp, cos, linspace
import matplotlib.pyplot as plt
import os, time, glob

def damped_vibrations(t, A, b, w):
    return A*exp(-b*t)*cos(w*t)

def compute(A, b, w, T, resolution=500):
    """Return filename of plot of the damped_vibration function."""
    t = linspace(0, T, resolution+1)
    u = damped_vibrations(t, A, b, w)
    plt.figure()  # needed to avoid adding curves in plot
    plt.plot(t, u)
    plt.title('A=%g, b=%g, w=%g' % (A, b, w))
    if not os.path.isdir('static'):
        os.mkdir('static')
    else:
        # Remove old plot files
        for filename in glob.glob(os.path.join('static', '*.png')):
            os.remove(filename)
    # Use time since Jan 1, 1970 in filename in order make
    # a unique filename that the browser has not chached
    plotfile = os.path.join('static', str(time.time()) + '.png')
    plt.savefig(plotfile)
    return plotfile

if __name__ == '__main__':
    print compute(1, 0.1, 1, 20)
It is in general not a good idea to write plots to file or let a
web app write to file. If this app is deployed at some web site and
multiple users are running the app, the os.remove statements may remove
plots created by all other users. However, the app is useful as a
graphical user interface run locally on a machine.
Later, we shall avoid writing plot files and instead
store plots in strings and embed the strings
in the img tag in the HTML code.
We organize the model, view, and controller as three separate files, as illustrated in the section Splitting the app into model, view, and controller files. This more complicated app involves more code and especially the model will soon be handy to isolate in its own file.
Our first version of model.py reads
from wtforms import Form, FloatField, validators
from math import pi

class InputForm(Form):
    A = FloatField(
        label='amplitude (m)', default=1.0,
        validators=[validators.InputRequired()])
    b = FloatField(
        label='damping factor (kg/s)', default=0,
        validators=[validators.InputRequired()])
    w = FloatField(
        label='frequency (1/s)', default=2*pi,
        validators=[validators.InputRequired()])
    T = FloatField(
        label='time interval (s)', default=18,
        validators=[validators.InputRequired()])
As seen, the field classes can take a label argument for a longer
description, here also including the units in which the variable is
measured. It is also possible to add a description argument with
some help message. Furthermore, we include a default value, which
will appear in the text field such that the user does not need to
fill in all values.
The view component will of course make use of templates, and we shall experiment
with different templates. Therefore, we allow a command-line argument
to this Flask app for choosing which template we want. The rest of
the controller.py file follows much the same set up as for the scientific
hello world app:
from model import InputForm
from flask import Flask, render_template, request
from compute import compute

app = Flask(__name__)

@app.route('/vib1', methods=['GET', 'POST'])
def index():
    form = InputForm(request.form)
    if request.method == 'POST' and form.validate():
        result = compute(form.A.data, form.b.data,
                         form.w.data, form.T.data)
    else:
        result = None

    return render_template('view.html', form=form, result=result)

if __name__ == '__main__':
    app.run(debug=True)
The details governing how the web page really looks like lie in the
template file. Since we have several fields and want them nicely
align in a tabular fashion, we place the field name, text areas,
and labels inside an HTML table in our first attempt to write a
template, view_plain.html:
<form method=post action="">
<table>
  {% for field in form %}
    <tr>
    <td>{{ field.name }}</td><td>{{ field }}</td>
    <td>{{ field.label }}</td>
    </tr>
  {% endfor %}
</table>
<p><input type=submit value=Compute></form></p>

<p>
{% if result != None %}
<img src="{{ result }}" width="500">
{% endif %}
</p>
form object and grab data
for each field: field.name is the name of the variable in the
InputForm class, field.label is the full name with units as given
through the label keyword when constructing the field object, and
writing the field object itself generates the text area for
input (i.e., the HTML input form). The control statements we can
use in the template are part of the Jinja2
templating language. For now, the if-test, for-loop and
output of values ({{ object }}) are enough to generate the HTML
code we want.
Recall that the objects we need in the template, like result and form
in the present case, are transferred to the template via keyword
arguments to the render_template function. We can easily pass on
any object in our application to the template. Debugging of the template
is done by viewing the HTML source of the web page in the browser.
You are encouraged to go to the vib1 directory,
run python controller.py, and load
`http://127.0.0.1:5000/vib1`