Rearranging the elements in the HTML template
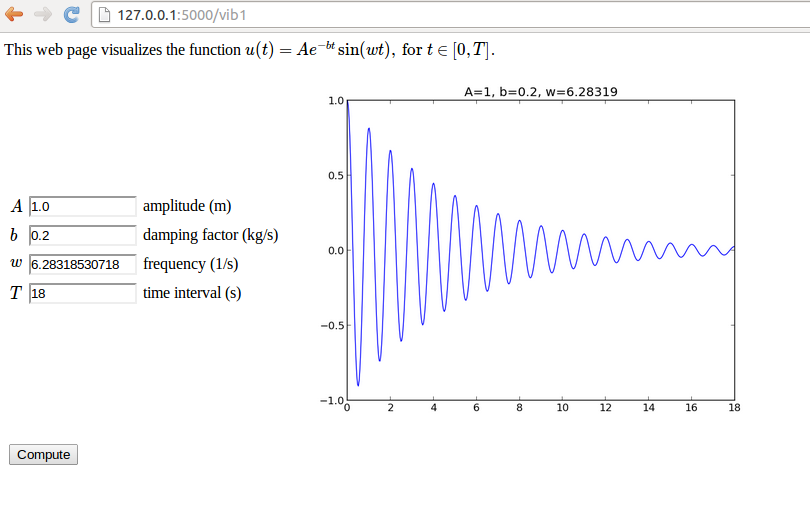
Now we want to place the plot to the right of the input forms in the web page, see Figure 8. This can be accomplished by having an outer table with two rows. The first row contains the table with the input forms in the first column and the plot in the second column, while the second row features the Compute button in the first column.
Figure 8: New design with input and output side by side.

The enabling template file is view_table.html:
<script type="text/x-mathjax-config">
MathJax.Hub.Config({
  TeX: {
     equationNumbers: {  autoNumber: "AMS"  },
     extensions: ["AMSmath.js", "AMSsymbols.js", "autobold.js"]
  }
});
</script>
<script type="text/javascript"
 src="http://cdn.mathjax.org/mathjax/latest/MathJax.js?config=TeX-AMS-MML_HTMLorMML">
</script>

This web page visualizes the function \(
u(t) = Ae^{-bt}\sin (w t), \hbox{ for } t\in [0,T]
\).

<form method=post action="">
<table> <!-- table with forms to the left and plot to the right -->
<tr><td>
<table>
  {% for field in form %}
    <tr>
    <td>\( {{ field.name }} \)</td><td>{{ field(size=12) }}</td>
    <td>{{ field.label }}</td>
    {% if field.errors %}
      <td><ul class=errors>
      {% for error in field.errors %}
        <li><font color="red">{{ error }}</font></li>
      {% endfor %}</ul></td>
    {% endif %}
    </tr>
  {% endfor %}
</table>
</td>

<td>
<p>
{% if result != None %}
<img src="{{ result }}" width="500">
{% endif %}
</p>
</td></tr>
<tr>
<td><p><input type=submit value=Compute></p></td>
</tr>
</table>
</form>