Implementation (1)
This section present the complete computational algorithm, its implementation in Python code, animation of the solution, and verification of the implementation.
A real implementation of the basic computational algorithm from the sections Formulating a recursive algorithm and Sketch of an implementation can be encapsulated in a function, taking all the input data for the problem as arguments. The physical input data consists of \(c\), \(I(x)\), \(V(x)\), \(f(x,t)\), \(L\), and \(T\). The numerical input is the mesh parameters \(\Delta t\) and \(\Delta x\). One possibility is to specify \(N_x\) and the Courant number \(C=c\Delta t/\Delta x\). The latter is convenient to prescribe instead of \(\Delta t\) when performing numerical investigations, because the numerical accuracy depends directly on \(C\).
The solution at all spatial points at a new time level is stored in an array u (of length \(N_x+1\)). We need to decide what do to with this solution, e.g., visualize the curve, analyze the values, or write the array to file for later use. The decision what to do is left to the user in a suppled function
def user_action(u, x, t, n):
where u is the solution at the spatial points x at time t[n].
Making a solver function
A first attempt at a solver function is listed below.
from numpy import *

def solver(I, V, f, c, L, Nx, C, T, user_action=None):
    """Solve u_tt=c^2*u_xx + f on (0,L)x(0,T]."""
    x = linspace(0, L, Nx+1)     # Mesh points in space
    dx = x[1] - x[0]
    dt = C*dx/c
    Nt = int(round(T/dt))
    t = linspace(0, Nt*dt, Nt+1) # Mesh points in time
    C2 = C**2                    # Help variable in the scheme
    if f is None or f == 0 :
        f = lambda x, t: 0
    if V is None or V == 0:
        V = lambda x: 0

    u   = zeros(Nx+1)   # Solution array at new time level
    u_1 = zeros(Nx+1)   # Solution at 1 time level back
    u_2 = zeros(Nx+1)   # Solution at 2 time levels back

    import time;  t0 = time.clock()  # for measuring CPU time

    # Load initial condition into u_1
    for i in range(0,Nx+1):
        u_1[i] = I(x[i])

    if user_action is not None:
        user_action(u_1, x, t, 0)

    # Special formula for first time step
    n = 0
    for i in range(1, Nx):
        u[i] = u_1[i] + dt*V(x[i]) + \
               0.5*C2*(u_1[i-1] - 2*u_1[i] + u_1[i+1]) + \
               0.5*dt**2*f(x[i], t[n])
    u[0] = 0;  u[Nx] = 0

    if user_action is not None:
        user_action(u, x, t, 1)

    # Switch variables before next step
    u_2[:], u_1[:] = u_1, u

    for n in range(1, Nt):
        # Update all inner points at time t[n+1]
        for i in range(1, Nx):
            u[i] = - u_2[i] + 2*u_1[i] + \
                     C2*(u_1[i-1] - 2*u_1[i] + u_1[i+1]) + \
                     dt**2*f(x[i], t[n])

        # Insert boundary conditions
        u[0] = 0;  u[Nx] = 0
        if user_action is not None:
            if user_action(u, x, t, n+1):
                break

        # Switch variables before next step
        u_2[:], u_1[:] = u_1, u

    cpu_time = t0 - time.clock()
    return u, x, t, cpu_time
Verification: exact quadratic solution
We use the test problem derived in the section A slightly generalized model problem for verification. Here is a function realizing this verification as a .. cite
nose test:
import nose.tools as nt

def test_quadratic():
    """Check that u(x,t)=x(L-x)(1+t/2) is exactly reproduced."""
    def exact_solution(x, t):
        return x*(L-x)*(1 + 0.5*t)

    def I(x):
        return exact_solution(x, 0)

    def V(x):
        return 0.5*exact_solution(x, 0)

    def f(x, t):
        return 2*(1 + 0.5*t)*c**2

    L = 2.5
    c = 1.5
    Nx = 3  # Very coarse mesh
    C = 0.75
    T = 18

    u, x, t, cpu = solver(I, V, f, c, L, Nx, C, T)
    u_e = exact_solution(x, t[-1])
    diff = abs(u - u_e).max()
    nt.assert_almost_equal(diff, 0, places=14)
Visualization: animating the solution
Now that we have verified the implementation it is time to do a real computation where we also display the evolution of the waves on the screen.
Visualization via SciTools
The following viz function defines a user_action callback function for plotting the solution at each time level:
def viz(I, V, f, c, L, Nx, C, T, umin, umax, animate=True):
    """Run solver and visualize u at each time level."""
    import scitools.std as plt
    import time, glob, os

    def plot_u(u, x, t, n):
        """user_action function for solver."""
        plt.plot(x, u, 'r-',
                 xlabel='x', ylabel='u',
                 axis=[0, L, umin, umax],
                 title='t=%f' % t[n], show=True)
        # Let the initial condition stay on the screen for 2
        # seconds, else insert a pause of 0.2 s between each plot
        time.sleep(2) if t[n] == 0 else time.sleep(0.2)
        plt.savefig('frame_%04d.png' % n)  # for movie making

    # Clean up old movie frames
    for filename in glob.glob('frame_*.png'):
        os.remove(filename)

    user_action = plot_u if animate else None
    u, x, t, cpu = solver(I, V, f, c, L, Nx, C, T, user_action)

    # Make movie files
    fps = 4  # Frames per second
    plt.movie('frame_*.png', encoder='html', fps=fps,
              output_file='movie.html')
    codec2ext = dict(flv='flv', libx64='mp4', libvpx='webm',
                     libtheora='ogg')
    filespec = 'frame_%04d.png'
    movie_program = 'avconv'  # or 'ffmpeg'
    for codec in codec2ext:
        ext = codec2ext[codec]
        cmd = '%(movie_program)s -r %(fps)d -i %(filespec)s '\
              '-vcodec %(codec)s movie.%(ext)s' % vars()
        os.system(cmd)
A function inside another function, like plot_u in the above code segment, has access to and remembers all the local variables in the surrounding code inside the viz function (!). This is known in computer science as a closure and is very convenient to program with. For example, the plt and time modules defined outside plot_u are accessible for plot_u when the function is called (as user_action) in the solver function. Some may think, however, that a class instead of a closure is a cleaner and easier-to-understand implementation of the user action function, see the section Building a general 1D wave equation solver.
Making movie files
Several hardcopies of the animation are made from the frame_*.png files. The first movie, made by the SciTools function plt.movie creates a movie.html file with a movie player for displaying the frame_*.png files. This movie player can be generated from the command line too
Terminal> scitools movie encoder=html output_file=movie.html \
          fps=4 frame_*.png
We also use the avconv (or ffmpeg) programs to make movie files in modern formats: Flash, MP4, Webm, and Ogg. A typical avconv (or ffmpeg) command for creating a movie file in Ogg format with 4 frames per second built from a collection of plot files with names generated by frame_%04d.png, look like
Terminal> avconv -r 4 -i frame_%04d.png -vcodec libtheora movie.ogg
The different formats require different video encoders (-vcodec) to be installed: Flash applies flv, WebM applies libvpx, and MP4 applies libx64. Players like vlc, mplayer, gxine, and totem can be used to play these movie files.
Note that padding the frame counter with zeros in the frame_*.png files, as specified by the %04d format, is essential so that the wildcard notation frame_*.png expands to the correct set of files.
Skipping frames for animation speed
Sometimes the time step is small and \(T\) is large, leading to an inconveniently large number of plot files and a slow animation on the screen. The solution to such a problem is to decide on a total number of frames in the animation, num_frames, and plot the solution only at every every frame. The total number of time levels (i.e., maximum possible number of frames) is the length of t, t.size, and if we want num_frames, we need to plot every t.size/num_frames frame:
every = int(t.size/float(num_frames))
if n % every == 0 or n == t.size-1:
    st.plot(x, u, 'r-', ...)
The initial condition (n=0) is natural to include, and as n % every == 0 will very seldom be true for the very final frame, we also ensure that n == t.size-1 and hence the final frame is included.
A simple choice of numbers may illustrate the formulas: say we have 801 frames in total (t.size) and we allow only 60 frames to be plotted. Then we need to plot every 801/60 frame, which with integer division yields 13 as every. Using the mod function, n % every, this operation is zero every time n can be divided by 13 without a remainder. That is, the if test is true when n equals \(0, 13, 26, 39, ..., 780, 801\). The associated code is included in the plot_u function in the file wave1D_u0_sv.py.
Visualization via Matplotlib
The previous code based on the plot interface from scitools.std can be run with Matplotlib as the visualization backend, but if one desires to program directly with Matplotlib, quite different code is needed. Matplotlib’s interactive mode must be turned on:
import matplotlib.pyplot as plt
plt.ion()  # interactive mode on
The most commonly used animation technique with Matplotlib is to update the data in the plot at each time level:
# Make a first plot
lines = plt.plot(t, u)
# call plt.axis, plt.xlabel, plt.ylabel, etc. as desired

# At later time levels
lines[0].set_ydata(u)
plt.legend('t=%g' % t[n])
plt.draw()  # make updated plot
plt.savefig(...)
An alternative is to rebuild the plot at every time level:
plt.clf()        # delete any previous curve(s)
plt.axis([...])
plt.plot(t, u)
# plt.xlabel, plt.legend and other decorations
plt.draw()
plt.savefig(...)
Many prefer to work with figure and axis objects as in MATLAB:
fig = plt.figure()
...
fig.clf()
ax = fig.gca()
ax.axis(...)
ax.plot(t, u)
# ax.set_xlabel, ax.legend and other decorations
plt.draw()
fig.savefig(...)
Running a case
The first demo of our 1D wave equation solver concerns vibrations of a string that is initially deformed to a triangular shape, like when picking a guitar string:
We choose \(L=75\) cm, \(x_0=0.8L\), \(a=5\) mm, \(N_x=50\), and a time frequency \(\nu = 440\) Hz. The relation between the wave speed \(c\) and \(\nu\) is \(c=\nu\lambda\), where \(\lambda\) is the wavelength, taken as \(2L\) because the longest wave on the string form half a wavelength. There is no external force, so \(f=0\), and the string is at rest initially so that \(V=0\). A function setting these physical parameters and calling viz for this case goes as follows:
def guitar(C):
    """Triangular wave (pulled guitar string)."""
    L = 0.75
    x0 = 0.8*L
    a = 0.005
    freq = 440
    wavelength = 2*L
    c = freq*wavelength
    omega = 2*pi*freq
    num_periods = 1
    T = 2*pi/omega*num_periods
    Nx = 50

    def I(x):
        return a*x/x0 if x < x0 else a/(L-x0)*(L-x)

    umin = -1.2*a;  umax = -umin
    cpu = viz(I, 0, 0, c, L, Nx, C, T, umin, umax, animate=True)
The associated program has the name wave1D_u0_s.py. Run the program and watch the movie of the vibrating string.
The benefits of scaling
The previous example demonstrated that quite some work is needed with establishing relevant physical parameters for a case. By scaling the mathematical problem we can often reduce the need to estimate physical parameters dramatically. A scaling consists of introducing new independent and dependent variables, with the aim that the absolute value of these vary between 0 and 1:
Replacing old by new variables in the PDE, using \(f=0\), and dropping the bars, results in the scaled equation \(u_{tt} = u_{xx}\). This equation has no physical parameter (!).
If we have a program implemented for the physical wave equation with dimensions, we can obtain the dimensionless, scaled version by setting \(c=1\). The initial condition corresponds to (10.21), but with setting \(a=1\), \(L=1\), and \(x_0\in [0,1]\). This means that we only need to decide on the \(x_0\) value as a fraction of unity, because the scaled problem corresponds to setting all other parameters to unity! In the code we can just set a=c=L=1, x0=0.8, and there is no need to calculate with wavelengths and frequencies to estimate \(c\).
The only non-trivial parameter to estimate in the scaled problem is the final end time of the simulation, or more precisely, how it relates to periods in periodic solutions in time, since we often want to express the end time as a certain number of periods. Suppose as \(u\) behaves as \(\sin (\omega t)\) in time in variables with dimension. The corresponding period is \(P=2\pi/\omega\). The frequency \(\omega\) is related to the wavelength \(\lambda\) of the waves through the relations \(\omega = kc\) and \(k=2\pi/\lambda\), giving \(\omega = 2\pi c/\lambda\) and \(P=\lambda/c\). It remains to estimate \(\lambda\). With \(u(x,t)=F(x)\sin\omega t\) we find from \(u_{tt}=c^2u_{xx}\) that \(c^2F'' + \omega^2F=0\), and the boundary conditions demand \(F(0)=F(L)=0\). The solution is \(F(x)=\sin(x\pi/L)\), which has wavelength \(\lambda = 2\pi/(\pi/L)=2L\). One period is therefore given by \(P=2L/c\). The dimensionless period is \(\bar P=Pc/L = 2\).
Vectorization
The computational algorithm for solving the wave equation visits one mesh point at a time and evaluates a formula for the new value \(u_i^{n+1}\) at that point. Technically, this is implemented by a loop over array elements in a program. Such loops may run slowly in Python (and similar interpreted languages such as R and MATLAB). One technique for speeding up loops is to perform operations on entire arrays instead of working with one element at a time. This is referred to as vectorization, vector computing, or array computing. Operations on whole arrays are possible if the computations involving each element is independent of each other and therefore can, at least in principle, be performed simultaneously. Vectorization not only speeds up the code on serial computers, but it also makes it easy to exploit parallel computing.
Operations on slices of arrays
Efficient computing with numpy arrays demands that we avoid loops and compute with entire arrays at once (or at least large portions of them). Consider this calculation of differences \(d_i = u_{i+1}-u_i\):
n = u.size
for i in range(0, n-1):
    d[i] = u[i+1] - u[i]
All the differences here are independent of each other. The computation of d can therefore alternatively be done by subtracting the array \((u_0,u_1,\ldots,u_{n-1})\) from the array where the elements are shifted one index upwards: \((u_1,u_2,\ldots,u_n)\), see Figure Illustration of subtracting two slices of two arrays. The former subset of the array can be expressed by u[0:n-1], u[0:-1], or just u[:-1], meaning from index 0 up to, but not including, the last element (-1). The latter subset is obtained by u[1:n] or u[1:], meaning from index 1 and the rest of the array. The computation of d can now be done without an explicit Python loop:
d = u[1:] - u[:-1]
or with explicit limits if desired:
d = u[1:n] - u[0:n-1]
Indices with a colon, going from an index to (but not including) another index are called slices. With numpy arrays, the computations are still done by loops, but in efficient, compiled, highly optimized code in C or Fortran. Such array operations can also easily be distributed among many processors on parallel computers. We say that the scalar code above, working on an element (a scalar) at a time, has been replaced by an equivalent vectorized code. The process of vectorizing code is called vectorization.
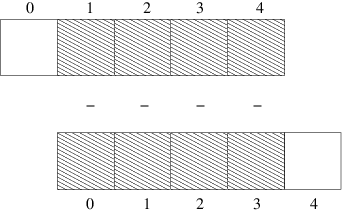
Illustration of subtracting two slices of two arrays
Test the understanding
Newcomers to vectorization are encouraged to choose a small array u, say with five elements, and simulate with pen and paper both the loop version and the vectorized version.
Finite difference schemes basically contains differences between array elements with shifted indices. Consider the updating formula
for i in range(1, n-1):
    u2[i] = u[i-1] - 2*u[i] + u[i+1]
The vectorization consists of replacing the loop by arithmetics on slices of arrays of length n-2:
u2 = u[:-2] - 2*u[1:-1] + u[2:]
u2 = u[0:n-2] - 2*u[1:n-1] + u[2:n]   # alternative
Note that u2 here gets length n-2. If u2 is already an array of length n and we want to use the formula to update all the “inner” elements of u2, as we will when solving a 1D wave equation, we can write
u2[1:-1]  = u[:-2] - 2*u[1:-1] + u[2:]
u2[1:n-1] = u[0:n-2] - 2*u[1:n-1] + u[2:n]   # alternative
Pen and paper calculations with a small array will demonstrate what is actually going on. The expression on the right-hand side are done in the following steps, involving temporary arrays with intermediate results, since we can only work with two arrays at a time in arithmetic expressions:
temp1 = 2*u[1:-1]
temp2 = u[0:-2] - temp1
temp3 = temp2 + u[2:]
u2[1:-1] = temp3
We can extend the previous example to a formula with an additional term computed by calling a function:
def f(x):
    return x**2 + 1

for i in range(1, n-1):
    u2[i] = u[i-1] - 2*u[i] + u[i+1] + f(x[i])
Assuming u2, u, and x all have length n, the vectorized version becomes
u2[1:-1] = u[:-2] - 2*u[1:-1] + u[2:] + f(x[1:-1])
Finite difference schemes expressed as slices
We now have the necessary tools to vectorize the algorithm for the wave equation. There are three loops: one for the initial condition, one for the first time step, and finally the loop that is repeated for all subsequent time levels. Since only the latter is repeated a potentially large number of times, we limit the efforts of vectorizing the code to this loop:
for i in range(1, Nx):
    u[i] = 2*u_1[i] - u_2[i] + \
           C2*(u_1[i-1] - 2*u_1[i] + u_1[i+1])
The vectorized version becomes
u[1:-1] = - u_2[1:-1] + 2*u_1[1:-1] + \
          C2*(u_1[:-2] - 2*u_1[1:-1] + u_1[2:])
or
u[1:Nx] = 2*u_1[1:Nx]- u_2[1:Nx] + \
          C2*(u_1[0:Nx-1] - 2*u_1[1:Nx] + u_1[2:Nx+1])
The program wave1D_u0_sv.py contains a new version of the function solver where both the scalar and the vectorized loops are included (the argument version is set to scalar or vectorized, respectively).
Verification (2)
We may reuse the quadratic solution \({u_{\small\mbox{e}}}(x,t)=x(L-x)(1+{\frac{1}{2}}t)\) for verifying also the vectorized code. A nose test can now test both the scalar and the vectorized version. Moreover, we may use a user_action function that compares the computed and exact solution at each time level and performs a test:
def test_quadratic():
    """
    Check the scalar and vectorized versions work for
    a quadratic u(x,t)=x(L-x)(1+t/2) that is exactly reproduced.
    """
    # The following function must work for x as array or scalar
    exact_solution = lambda x, t: x*(L - x)*(1 + 0.5*t)
    I = lambda x: exact_solution(x, 0)
    V = lambda x: 0.5*exact_solution(x, 0)
    # f is a scalar (zeros_like(x) works for scalar x too)
    f = lambda x, t: zeros_like(x) + 2*c**2*(1 + 0.5*t)

    L = 2.5
    c = 1.5
    Nx = 3  # Very coarse mesh
    C = 1
    T = 18  # Long time integration

    def assert_no_error(u, x, t, n):
        u_e = exact_solution(x, t[n])
        diff = abs(u - u_e).max()
        nt.assert_almost_equal(diff, 0, places=13)

    solver(I, V, f, c, L, Nx, C, T,
           user_action=assert_no_error, version='scalar')
    solver(I, V, f, c, L, Nx, C, T,
           user_action=assert_no_error, version='vectorized')
Lambda functions
The code segment above demonstrates how to achieve very compact code with the use of lambda functions for the various input parameters that require a Python function. In essence,
f = lambda x, t: L*(x-t)**2
is equivalent to
def f(x, t):
    return L(x-t)**2
Note that lambda functions can just contain a single expression and no statements.
One advantage with lambda functions is that they can be used directly in calls:
solver(I=lambda x: sin(pi*x/L), V=0, f=0, ...)
Efficiency measurements
Running the wave1D_u0_sv.py code with the previous string vibration example for \(N_x=50,100,200,400,800\), and measuring the CPU time (see the run_efficiency_experiments function), shows that the vectorized code runs substantially faster: the scalar code uses approximately a factor \(N_x/5\) more time!
Exercises (1)
Exercise 1: Simulate a standing wave
The purpose of this exercise is to simulate standing waves on \([0,L]\) and illustrate the error in the simulation. Standing waves arise from an initial condition
where \(m\) is an integer and \(A\) is a freely chosen amplitude. The corresponding exact solution can be computed and reads
a) Explain that for a function \(\sin kx\cos \omega t\) the wave length in space is \(\lambda = 2\pi /k\) and the period in time is \(P=2\pi/\omega\). Use these expressions to find the wave length in space and period in time of \({u_{\small\mbox{e}}}\) above.
b) Import the solver function wave1D_u0_s.py into a new file where the viz function is reimplemented such that it plots either the numerical and the exact solution, or the error.
c) Make animations where you illustrate how the error \(e^n_i ={u_{\small\mbox{e}}}(x_i, t_n)- u^n_i\) develops and increases in time. Also make animations of \(u\) and \({u_{\small\mbox{e}}}\) simultaneously.
Hint 1. Quite long time simulations are needed in order to display significant discrepancies between the numerical and exact solution.
Hint 2. A possible set of parameters is \(L=12\), \(m=9\), \(c=2\), \(A=1\), \(N_x=80\), \(C=0.8\). The error mesh function \(e^n\) can be simulated for 10 periods, while 20-30 periods are needed to show significant differences between the curves for the numerical and exact solution.
Filename: wave_standing.py.
Remarks
The important parameters for numerical quality are \(C\) and \(k\Delta x\), where \(C=c\Delta t/\Delta x\) is the Courant number and \(k\) is defined above (\(k\Delta x\) is proportional to how many mesh points we have per wave length in space, see the section Numerical dispersion relation for explanation).
Exercise 2: Add storage of solution in a user action function
Extend the plot_u function in the file wave1D_u0_s.py to also store the solutions u in a list. To this end, declare all_u as an empty list in the viz function, outside plot_u, and perform an append operation inside the plot_u function. Note that a function, like plot_u, inside another function, like viz, remembers all local variables in viz function, including all_u, even when plot_u is called (as user_action) in the solver function. Test both all_u.append(u) and all_u.append(u.copy()). Why does one of these constructions fail to store the solution correctly? Let the viz function return the all_u list converted to a two-dimensional numpy array. Filename: wave1D_u0_s_store.py.
Exercise 3: Use a class for the user action function
Redo Exercise 2: Add storage of solution in a user action function using a class for the user action function. That is, define a class Action where the all_u list is an attribute, and implement the user action function as a method (the special method __call__ is a natural choice). The class versions avoids that the user action function depends on parameters defined outside the function (such as all_u in Exercise 2: Add storage of solution in a user action function). Filename: wave1D_u0_s2c.py.
Exercise 4: Compare several Courant numbers in one movie
The goal of this exercise is to make movies where several curves, corresponding to different Courant numbers, are visualized. Import the solver function from the wave1D_u0_s movie in a new file wave_compare.py. Reimplement the viz function such that it can take a list of C values as argument and create a movie with solutions corresponding to the given C values. The plot_u function must be changed to store the solution in an array (see Exercise 2: Add storage of solution in a user action function or Exercise 3: Use a class for the user action function for details), solver must be computed for each value of the Courant number, and finally one must run through each time step and plot all the spatial solution curves in one figure and store it in a file.
The challenge in such a visualization is to ensure that the curves in one plot corresponds to the same time point. The easiest remedy is to keep the time and space resolution constant and change the wave velocity \(c\) to change the Courant number. Filename: wave_numerics_comparison.py.
Project 5: Calculus with 1D mesh functions
This project explores integration and differentiation of mesh functions, both with scalar and vectorized implementations. We are given a mesh function \(f_i\) on a spatial one-dimensional mesh \(x_i=i\Delta x\), \(i=0,\ldots,N_x\), over the interval \([a,b]\).
a) Define the discrete derivative of \(f_i\) by using centered differences at internal mesh points and one-sided differences at the end points. Implement a scalar version of the computation in a Python function and supply a nose test for the linear case \(f(x)=4x-2.5\) where the discrete derivative should be exact.
b) Vectorize the implementation of the discrete derivative. Extend the nose test to check the validity of the implementation.
c) To compute the discrete integral \(F_i\) of \(f_i\), we assume that the mesh function \(f_i\) varies linearly between the mesh points. Let \(f(x)\) be such a linear interpolant of \(f_i\). We then have
The exact integral of a piecewise linear function \(f(x)\) is given by the Trapezoidal rule. S how that if \(F_{i}\) is already computed, we can find \(F_{i+1}\) from
Make a function for a scalar implementation of the discrete integral as a mesh function. That is, the function should return \(F_i\) for \(i=0,\ldots,N_x\). For a nose test one can use the fact that the above defined discrete integral of a linear function (say \(f(x)=4x-2.5\)) is exact.
d) Vectorize the implementation of the discrete integral. Extend the nose test to check the validity of the implementation.
Hint. Interpret the recursive formula for \(F_{i+1}\) as a sum. Make an array with each element of the sum and use the “cumsum” (numpy.cumsum) operation to compute the accumulative sum: numpy.cumsum([1,3,5]) is [1,4,9].
e) Create a class MeshCalculus that can integrate and differentiate mesh functions. The class can just define some methods that call the previously implemented Python functions. Here is an example on the usage:
import numpy as np
calc = MeshCalculus(vectorized=True)
x = np.linspace(0, 1, 11)        # mesh
f = np.exp(x)                    # mesh function
df = calc.differentiate(f, x)    # discrete derivative
F = calc.integrate(f, x)         # discrete anti-derivative
Filename: mesh_calculus_1D.py.
![]()
Table Of Contents
Previous topic
Simulation of waves on a string
Next topic
Generalization: reflecting boundaries
