Reading and writing spreadsheet files
From school you are probably used to spreadsheet programs such as Microsoft Excel or LibreOffice. This type of program is used to represent a table of numbers and text. Each table entry is known as a cell, and one can easily perform calculations with cells that contain numbers. The application of spreadsheet programs for mathematical computations and graphics is steadily growing.
Also Python may be used to do spreadsheet-type calculations on tabular data. The advantage of using Python is that you can easily extend the calculations far beyond what a spreadsheet program can do. However, even if you can view Python as a substitute for a spreadsheet program, it may be beneficial to combine the two. Suppose you have some data in a spreadsheet. How can you read these data into a Python program, perform calculations on the data, and thereafter read the data back to the spreadsheet program? This is exactly what we will explain below through an example. With this example, you should understand how easy it is to combine Excel or LibreOffice with your own Python programs.
CSV files
The table of data in a spreadsheet can be saved in so-called CSV files, where CSV stands for comma separated values. The CSV file format is very simple: each row in the spreadsheet table is a line in the file, and each cell in the row is separated by a comma or some other specified separation character. CSV files can easily be read into Python programs, and the table of cell data can be stored in a nested list (table), which can be processed as we desire. The modified table of cell data can be written back to a CSV file and read into the spreadsheet program for further processing.

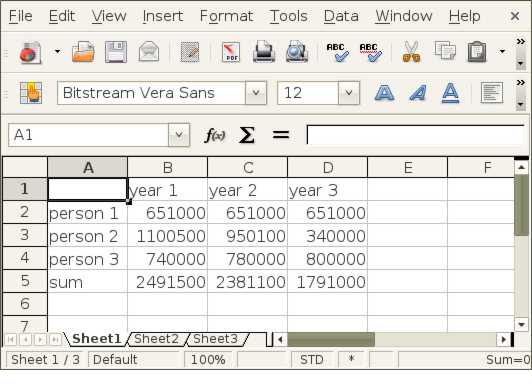
Figure 5 shows a simple spreadsheet in the LibreOffice program. The table contains \( 4\times 4 \) cells, where the first row contains column headings and the first column contains row headings. The remaining \( 3\times 3 \) subtable contains numbers that we may compute with. Let us save this spreadsheet to a file in the CSV format. The complete file will typically look as follows:
,"year 1","year 2","year 3"
"person 1",651000,651000,651000
"person 2",1100500,950100,340000
"person 3",740000,780000,800000
Our primary task is now to load these data into a Python program, compute the sum of each column, and write the data out again in the CSV format.
Reading CSV files
We start with loading the data into a table, represented as
a nested list, with aid of the
csv module from Python's standard library.
This approach gives us complete control of all
details. Later, we will use more high-level numpy functionality
for accomplishing the same thing with less lines.
The csv module offers functionality for reading one line at a time
from a CSV file:
infile = open('budget.csv', 'r')  # CSV file
import csv
table = []
for row in csv.reader(infile):
    table.append(row)
infile.close()
The row variable is a list of column values that are
read from the file by the csv module.
The three lines computing table can be condensed to one using
a list comprehension:
table = [row for row in csv.reader(infile)]
We can easily print table,
import pprint
pprint.pprint(table)
to see what the spreadsheet looks like when it is represented as a nested list in a Python program:
[['', 'year 1', 'year 2', 'year 3'],
 ['person 1', '651000', '651000', '651000'],
 ['person 2', '1100500', '950100', '340000'],
 ['person 3', '740000', '780000', '800000']]
Observe now that all entries are surrounded by quotes, which means that
all entries are string (str) objects. This is a general rule:
the csv module reads all cells into string objects.
To compute with the numbers, we need to transform the string objects
to float objects. The transformation
should not be applied to the first row and first column, since the
cells here hold text.
The transformation from strings to numbers
therefore applies to the indices r and c
in table (table[r][c]), such that the row counter
r goes from 1 to len(table)-1,
and the column counter c
goes from 1 to len(table[0])-1 (len(table[0]) is
the length of the first row, assuming the lengths of all rows are
equal to the length of the first row).
The relevant Python code for this transformation task becomes
 for r in range(1,len(table)):
    for c in range(1, len(table[0])):
        table[r][c] = float(table[r][c])
A pprint.pprint(table) statement after this transformation yields
[['', 'year 1', 'year 2', 'year 3'],
 ['person 1', 651000.0, 651000.0, 651000.0],
 ['person 2', 1100500.0, 950100.0, 340000.0],
 ['person 3', 740000.0, 780000.0, 800000.0]]
The numbers now have a decimal and no quotes, indicating
that the numbers are float objects and hence ready for mathematical
calculations.
Processing spreadsheet data
Let us perform a very simple calculation with table,
namely adding a final row
with the sum of the numbers in the columns:
row = [0.0]*len(table[0])
row[0] = 'sum'
for c in range(1, len(row)):
    s = 0
    for r in range(1, len(table)):
        s += table[r][c]
    row[c] = s
As seen, we first create a list row consisting of zeros.
Then we insert a text in the first column, before we invoke a
loop over the numbers in the table and compute the sum of each column.
The table list now represents a spreadsheet with four columns and
five rows:
[['', 'year 1', 'year 2', 'year 3'],
 ['person 1', 651000.0, 651000.0, 651000.0],
 ['person 2', 1100500.0, 950100.0, 340000.0],
 ['person 3', 740000.0, 780000.0, 800000.0],
 ['sum', 2491500.0, 2381100.0, 1791000.0]]
Writing CSV files
Our final task is to write the modified table list
back to a CSV file so that the data can be loaded in a spreadsheet program.
The write task is done by the code segment
outfile = open('budget2.csv', 'w')
writer = csv.writer(outfile)
for row in table:
    writer.writerow(row)
outfile.close()
The budget2.csv looks like this:
year 1,year 2,year 3
person 1,651000.0,651000.0,651000.0
person 2,1100500.0,950100.0,340000.0
person 3,740000.0,780000.0,800000.0
sum,2491500.0,2381100.0,1791000.0
The final step is to read budget2.csv into a spreadsheet.
The result is displayed in Figure 6
(in LibreOffice one must specify in the Open dialog that
the spreadsheet data are separated by commas, i.e., that the file
is in CSV format).
Figure 6: A spreadsheet processed in a Python program and loaded back into LibreOffice.
The complete program reading the budget.csv file, processing its
data, and writing the budget2.csv file can be found in
rw_csv.py. With this example at
hand, you should be in a good position to combine spreadsheet programs
with your own Python programs.
Remark
You may wonder why we used the csv module to read and write CSV
files when such files have comma separated values, which we can
extract by splitting lines with respect to the comma (this technique
is used in the section Example: Reading and plotting data recorded at specific dates to read a CSV file):
infile = open('budget.csv', 'r')
for line in infile:
    row = line.split(',')
This works well for the present budget.csv file, but the technique
breaks down when a text in a cell contains a comma, for instance
"Aug 8, 2007". The line.split(',') will split this cell text, while
the csv.reader functionality is smart enough to avoid splitting
text cells with a comma.
Representing number cells with Numerical Python arrays
Instead of putting the whole spreadsheet into a single nested list, we can make a Python data structure more tailored to the data at hand. What we have are two headers (for rows and columns, respectively) and a subtable of numbers. The headers can be represented as lists of strings, while the subtable could be a two-dimensional Numerical Python array. The latter makes it easier to implement various mathematical operations on the numbers. A dictionary can hold all the three items: two header lists and one array. The relevant code for reading, processing, and writing the data is shown below and can be found in the file rw_csv_numpy.py:
infile = open('budget.csv', 'r')
import csv
table = [row for row in csv.reader(infile)]
infile.close()

# Convert subtable of numbers (string to float)
import numpy
subtable = [[float(c) for c in row[1:]] for row in table[1:]]

data = {'column headings': table[0][1:],
        'row headings': [row[0] for row in table[1:]],
        'array': numpy.array(subtable)}

# Add a new row with sums
data['row headings'].append('sum')
a = data['array']   # short form
data['column sum'] = [sum(a[:,c]) for c in range(a.shape[1])]

outfile = open('budget2.csv', 'w')
writer = csv.writer(outfile)
# Turn data dictionary into a nested list first (for easy writing)
table = a.tolist()   # transform array to nested list
table.append(data['column sum'])
table.insert(0, data['column headings'])
# Extend table with row headings (a new column)
[table[r+1].insert(0, data['row headings'][r])
 for r in range(len(table)-1)]
for row in table:
    writer.writerow(row)
outfile.close()
The code makes heavy use of list comprehensions, and the
transformation between a nested list, for file reading and writing,
and the data dictionary, for representing the data in the
Python program, is non-trivial. If you manage to understand every
line in this program, you have digested a lot of topics in
Python programming!
Using more high-level Numerical Python functionality
The previous program can be shortened significantly by applying
the genfromtxt function from Numerical Python:
import numpy as np
arr = np.genfromtxt('budget.csv', delimiter=',', dtype=str)

data = {'column headings': arr[0,1:].tolist(),
        'row headings': arr[1:,0].tolist(),
        'array': np.asarray(arr[1:,1:], dtype=np.float)}

data['row headings'].append('sum')
data['column sum'] = np.sum(data['array'], axis=1).tolist()
Doing a repr(arr) on the array returned from genfromtxt
results in
array([['', '"year 1"', '"year 2"', '"year 3"'],
       ['"person 1"', '651000', '651000', '651000'],
       ['"person 2"', '1100500', '950100', '340000'],
       ['"person 3"', '740000', '780000', '800000']],
      dtype='|S10')
That is, the data in the CSV file are available as an array of
strings. The code shows how we can easily use slices to extract the
row and column headings, convert the numbers to a floating-point array
for computations, compute the sums, and store various object in the
data dictionary. Then we may write a CSV file as described in the
previous example (see rw_csv_numpy2.py) or we may take a different
approach and extend the arr array with an extra row and fill in the
row heading and the sums (see rw_csv_numpy3.py for the complete code):
arr = np.genfromtxt('budget.csv', delimiter=',', dtype=str)

# Add row for sum of columns
arr.resize((arr.shape[0]+1, arr.shape[1]))
arr[-1,0] = '"sum"'
subtable = np.asarray(arr[1:-1,1:], dtype=np.float)
sum_row = np.sum(subtable, axis=1)
arr[-1,1:] = np.asarray(sum_row, dtype=str)

# numpy.savetxt writes table with a delimiter between entires
np.savetxt('budget2c.csv', arr, delimiter=',', fmt='%s')
Observe how we extract the numbers in subtable, compute with them,
and put the results back into the arr array as strings. The
savetxt function saves a two-dimensional array as a plain table in
a text file, here with
comma as delimiter. The function suffices in this example, none of
the approaches with genfromtxt and savetxt work with
column or row headings containing a comma. Then we need to use the
csv module.