

|
|
|
from matplotlib.pyplot import *
def plot_numerical_and_exact(theta, I, a, T, dt):
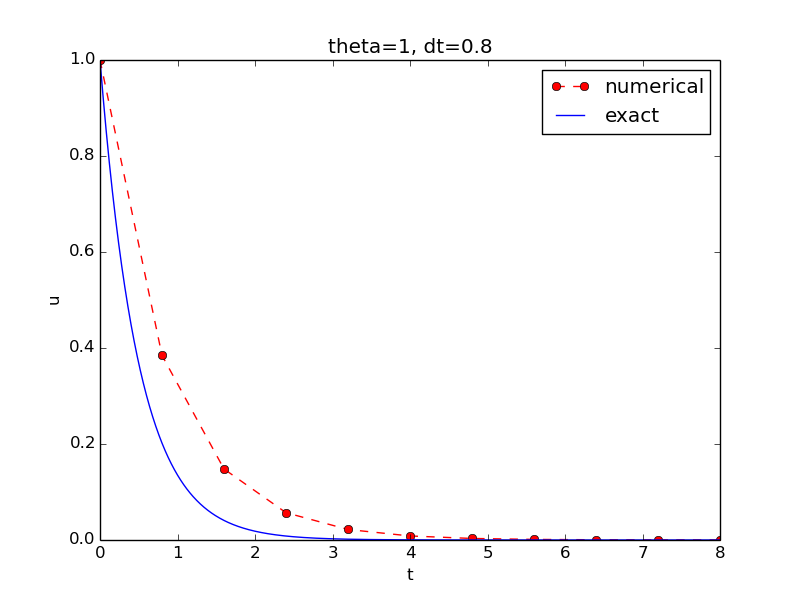
"""Compare the numerical and exact solution in a plot."""
u, t = solver(I=I, a=a, T=T, dt=dt, theta=theta)
t_e = linspace(0, T, 1001) # fine mesh for u_e
u_e = exact_solution(t_e, I, a)
plot(t, u, 'r--o', # red dashes w/circles
t_e, u_e, 'b-') # blue line for exact sol.
legend(['numerical', 'exact'])
xlabel('t')
ylabel('u')
title('theta=%g, dt=%g' % (theta, dt))
savefig('plot_%s_%g.png' % (theta, dt))
Complete code in decay_v2.py
|
|
|